Results 6
This batch of tests continued from batch 5.
As described in test 5 summary, this compares results from the two betting strategy elements.
The second betting strategy “Refined” was abandoned after day 5, as the risk associated with it was deemed too high. In did in a sense contradict the principle of spreading risk.
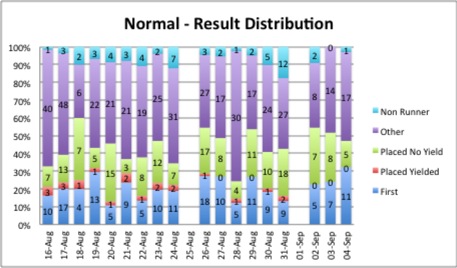
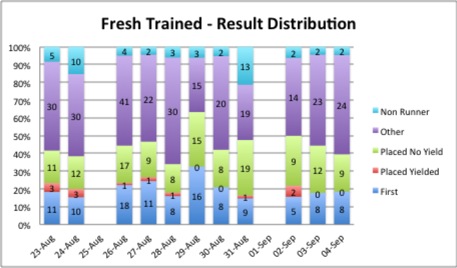
As of 23/08 an alternate genome training strategy was introduced. Prior to this point the genome training each night started from a baseline of the previous nights best Genome. It is felt that the see-saw in results may be due to over-specialisation following a good day, leading to a “bad” result the next day. To test this theory , a second stream (same betting strategy) where the genome training starts from a clean sheet will be run in parallel. This is called “Fresh Trained”.
Note: Sundays are deliberately omitted. There are very few races on Sundays and therefore are inherently variable.

Result Data
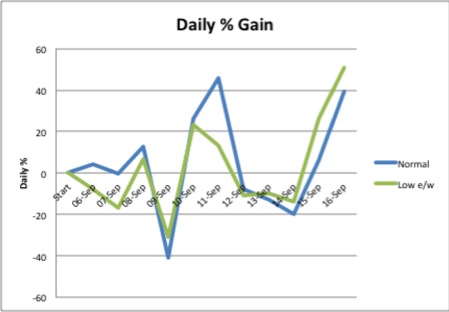
The following graphs provide a view on the performance of the Predictor, verified by the witnesses. The results start from 16/08/2012..
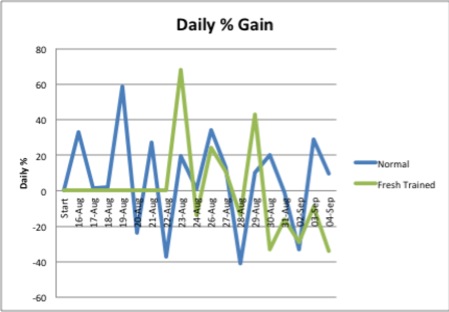
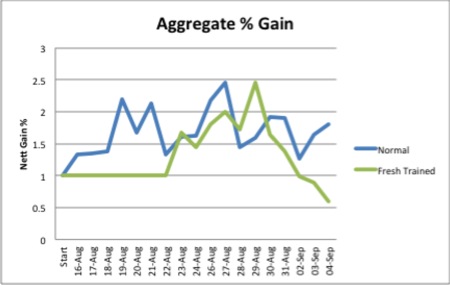
The above shows the percentage gain and nett gain per day for each strategy.
Below are the detailed breakdown.
Results 7
This batch of tests continued from batch 6.
Here we test two variants of the betting strategy, using the same normal genome generation strategy.
Result Data
The following graphs provide a view on the performance of the Predictor, verified by the witnesses. The results start from 06/09/2013..
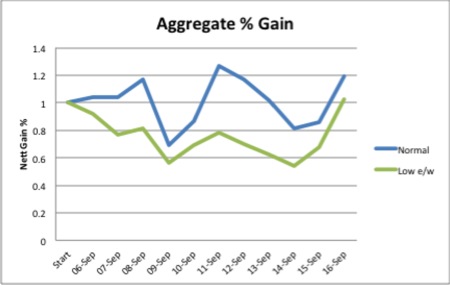
The above shows the percentage gain and nett gain per day for each strategy.
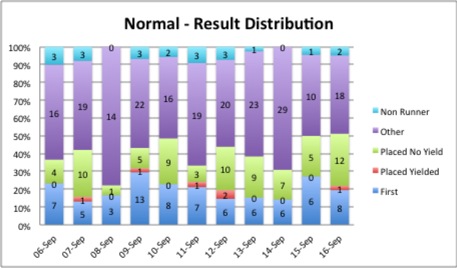
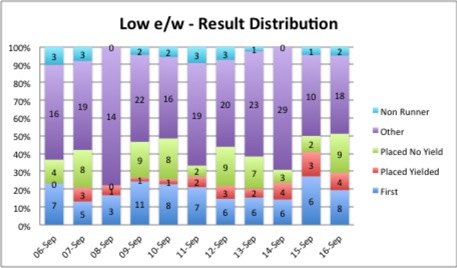
Below are the detailed breakdown.
Results 8
This batch of tests continued from batch 7.
The Low e/w betting strategy is dropped.
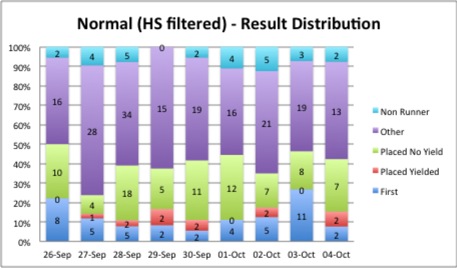
The alternate Betting Strategy used here examines the parametrized data from the Genome. This consists of Horse, Trainer and Jockey scores that contribute to the overall score for a horse in a race. This strategy filters out those horses which have a Horse Score below a specified value.
Here we test the normal and “Horse Score Filtered” variants of the betting strategy, using the same normal genome generation strategy.

Result Data
The following graphs provide a view on the performance of the Predictor, verified by the witnesses. The results start from 17/09/2013..
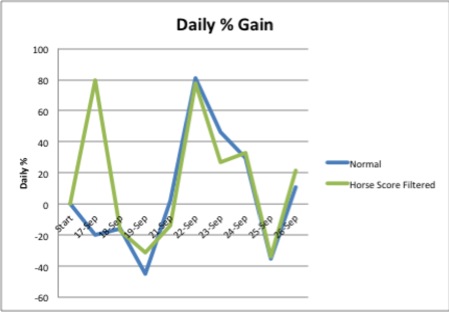
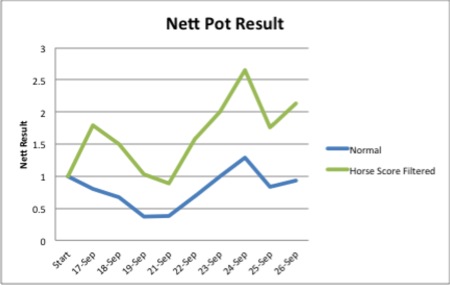
The above shows the percentage gain and nett pot size (starting from1) per day for each strategy.
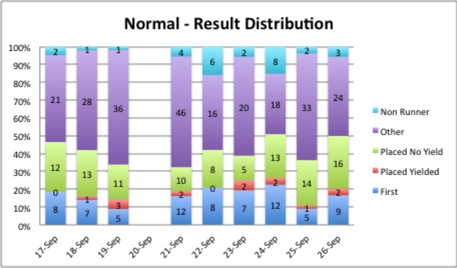
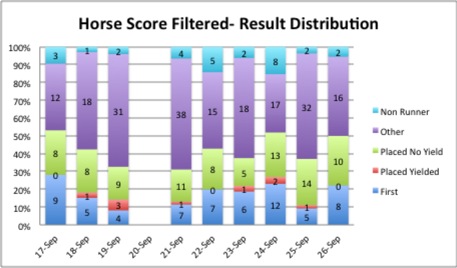
Below are the detailed breakdown.
Results 9
This batch of tests continued from batch 8.
Test 8 indicates that using horse score filter yields better results, this is now adopted.
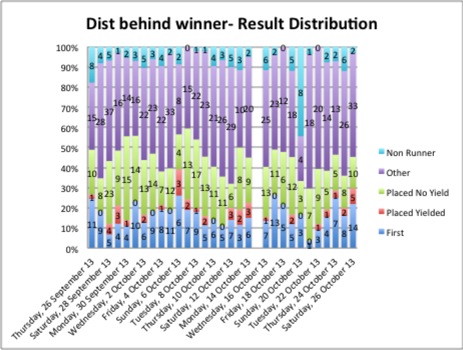
This test uses a variation on assessing the horses history, that uses the distance the horse is behind the winner instead of absolute position.
As of 05/10 the normal strategy was not taken forward.

Result Data
The following graphs provide a view on the performance of the Predictor, verified by the witnesses. The results start from 26/09/2013..
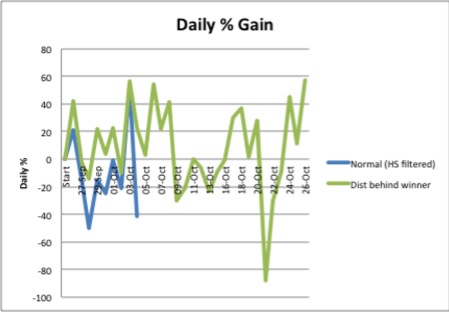
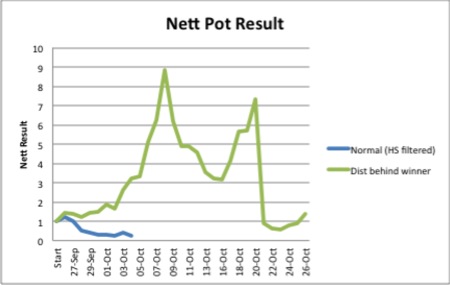
The above shows the percentage gain and nett pot size (starting from1) per day for each strategy.
Below are the detailed breakdown.